Data profile
On this page you can find an how to guide for setting up a playable data profile.
What is a data profile?
A data profile is a tool for analyzing data, it will let the simulation react to data over time. Data is collected over a certain amount of time and loaded into PsxCad as a tabbed txt-document. A timer within the data profile that can be set on play, pauze or stop will go through the samples of the data and it will return a sample that will be updated with the next sample over time. This sample can be used as a setpoint or process value within the simulation.
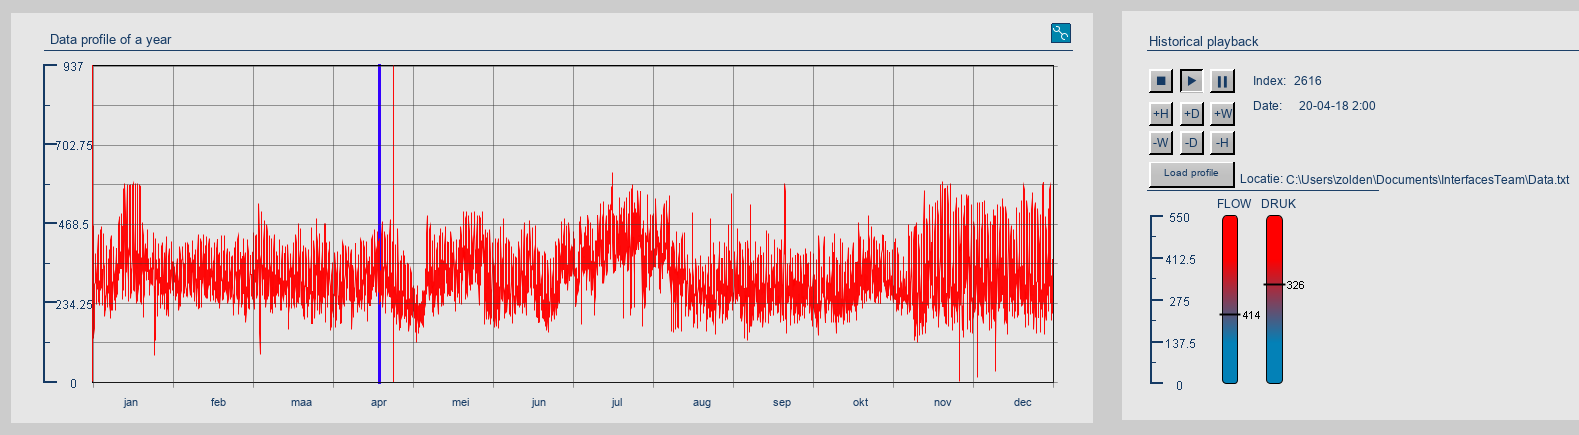
Normally the data profile will be represented on a graph with a time line as the x-axis next to some buttons for loading, playing, pausing and stopping the data profile. There can also be buttons for fast forwarding or rewinding the time within the data profile or a representation of the current values given out by the data profile. See the example below for a data profile of a year for flow and pressure values.
How to set up a data profile?
A data profile can be set up in multiple ways, but in general it is set up as follows. A LOAD_DATA symbol will load external data as a txt file and convert it into multiple arrays. On these arrays an index array is implemented, so it will return a double value from the array depending on the index. The index will be used as a counter to vary the returned double value from the data profile. The timed counter can be controlled by the play, pause and stop buttons. To fast forward or rewind data the data profile the index value can be adjusted.
Next to importing from other projects, it is possible to design and program a new symbol that handles the functions around the index array yourself or to use existing symbols. For a direct approach with the basic library at hand, it can be recommended to take the symbol IN_ARRAY and adjust this to make the index variable. The TIMER_ON and the PULSE_COUNT symbol can be used to design a timed counter for indexing the data profile. Like in the setup example below. In this setup the timer is used as a pulser by using its inverted output value as input and the PULSE_COUNT symbol is used to count up the index value depending the start, pause and stop input symbols.
Step by step guide on how to set up the example above
This guide is ment to get beginners on track. An experienced PsxCad user could also program one single logic symbol that handles the data profile maybe even better.
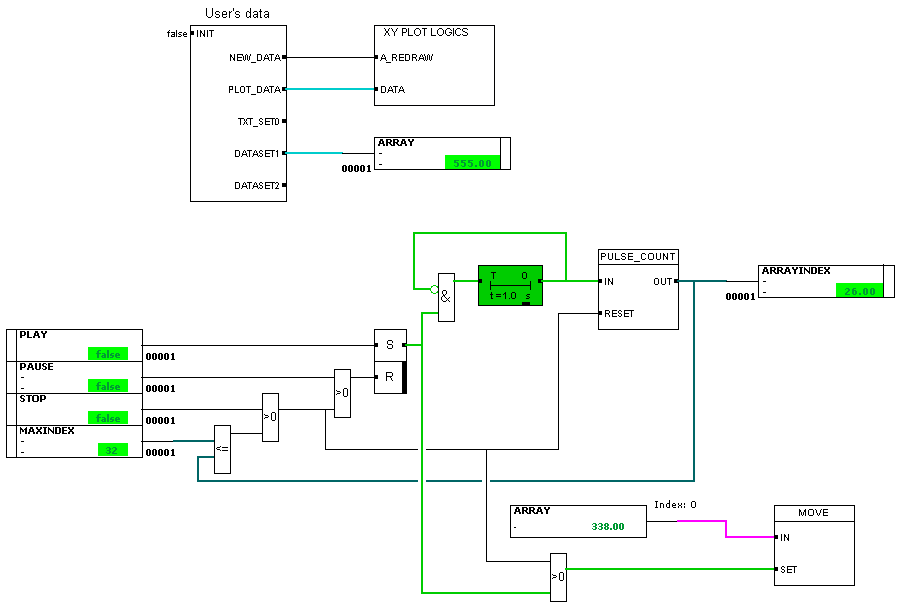
This data profile is kept simple and only contains symbols from the basic library. This model can be modified to something similar like Figure 1.
Step 1: HMI control buttons and graph
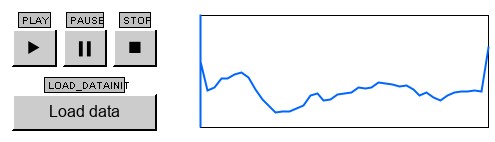
To start buttons to control the system can be placed on the HMI in screen mode. In this example it was done with BUTTOM_HMI symbols, but you are free to do it differently. On the right, we used the T_TRENDLINE symbol for the graph. The tag names you give to these symbols will return in the logics section. The button for loading data will have to trigger the INIT input of the LOAD_DATA symbol to call up a popup for selecting data. This can be done by adding the INIT in the tag. All buttons can get the key function &KEY&218 in their 'ID text (commands)' field (G) to generate one pulse when being clicked.
Step 2: Load data and XY logics
Place the LOAD_DATA and XY_PLOT_LOGICS connected as shown in the example. The XY_PLOT_LOGICS symbol interacts with the T_TRENDLINE symbol and should have the same tag name to be paired. An OUT symbol can be placed at the DATASET outputs of the LOAD_DATA symbol to keep the desired arrays separate.
Step 3: Placing a pulser and counter that controls indexing
We place a TIMER_ON whose output is used as feed back and inverted on its input. We do the inverting by displaying the symbol parameters on the signal line with (E) and checking the INVERT parameter. Now we have created a timer that delivers a pulse every so often. This will then also contain the time intervals of the data profile. This is customizable in the TIMER_ON symbol.
With the PULSE_COUNT symbol, pulses can be counted to create a counter with an OUT symbol as output that serves as an index within the data profile. See the connection in the Figure 2 example.
Step 4: Handling the Start, pause and stop commands
We create IN symbols with the same names as our control buttons, so they are linked. Next a SET_RESET symbol is placed, which is set by the play button and reset by the pause or stop button with an OR gate. The SET_RESET symbol determines when the data profile is playing. Only in the state of playing is the timer allowed to continue running. Therefore, we add an AND gate between the TIMER_ON input and the inverted signal. The SET_RESET symbol output is also connected to this AND gate so that the timer is controlled by the buttons.
The stop button can also reset the timer, which means it has a signal line connected to the reset input of the pulse counter.
Step 5: Resetting or stopping in case of overindexing
At some point the index exceeds the size of the array. The dataprofile can then be stopped or reset. In this example it will be stopped. We create an IN symbol where we will store the size of the array. If it is less than or equal to the index, a signal must be given to stop. So one lets the signal from this IN symbol along with a feedback signal from the index go into a comparator, whose output is entangled with the stop signal using an OR gate.
If one wants to reset instead of stopping, one must ensure that only the reset of the pulse counter is triggered when the index is exceeding.
Step 6: Indexing array with move output or normal output
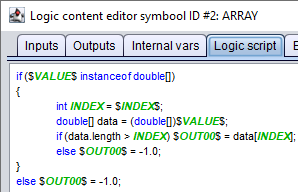
Using the index, one must now extract a value from the array that represents the current value of the data profile. This can be done with an IN_ARRAY symbol, which has the same tag name as the array. In most cases the indexing of these IN_ARRAY symbols is fixed. If this is the case you will have to make it variable by adding a variable in the logic content and in the logic script assigning this variable to the index. See the code below in Figure 4. This variable must be paired to the ascending index by tag name.
After this indexed array comes an OUT symbol or a MOVE symbol. By using a MOVE symbol, the output of the data profile can be written manually. Here one could use a manual state or use the control panel to decide when to write the output manually or not. In the example we chose to have the output written when the data profile playback is active and when the reset signal is given. These two signals are applied to the SET input of the MOVE symbol using the OR gate.
Related topics
LOAD_DATA symbol