Simulator Control Box
During runtime, you can utilize several simulation related functions and settings using the Simulator Control Box (Figure 1).
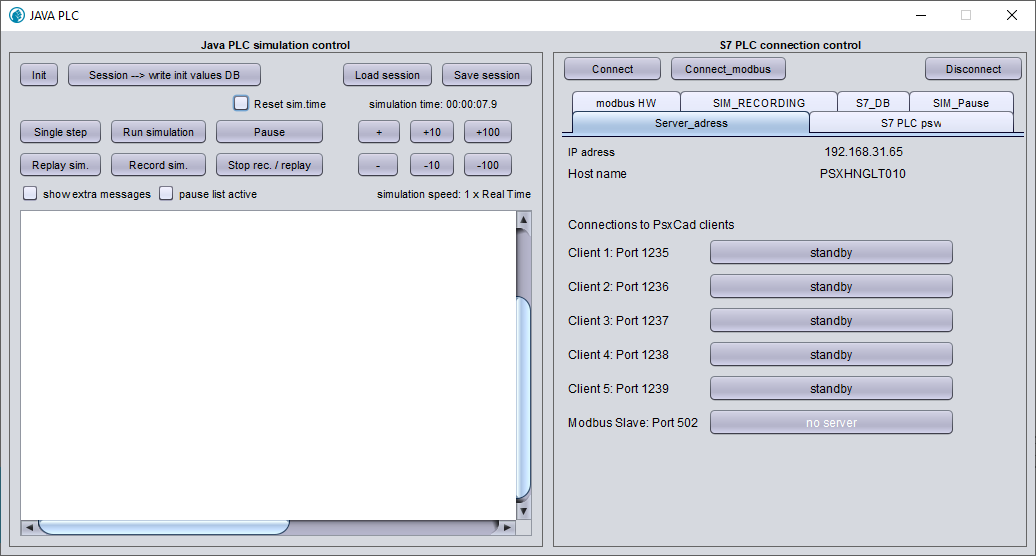
The Simulator Control Box appears automatically when runtime is started (). On the left side of the panel you will find buttons to control simulation related functions such as simulaton speed, save and load sessions and scenario recording.
All buttons, tick boxes and their functionality are further described below.
Simulation control

 Play and pause
Button |
Active state |
Functionality |
|
|
Start simulation. The button turns green when the simulation is running. |
|
|
Pause simulation. The button turns orange when the simulation is paused. |
|
- |
Increment simulation time by 1 scan time (usually 0.1 seconds). This button only works when the simulation is paused. |
|
- |
Shows running time of current session |
|
|
Reset simulation time. The tick symbol will disappear shortly after the simulation time has been reset. |


 Speed control
Button |
Functionality |
|
Increment simulation speed by 1, 10 or 100, respectively. |
|
Decrement simulation speed by 1, 10 or 100, respectively. |
|
Shows current simulation speed. |


 Initialize and session write
Init is short for Initial state (or default). A simulation always starts in its initial state. You can create an initial state using specific buttons on the Simulator Control Box.
Button |
Functionality |
|
Write current values and configuration to Initial state. In other words, you will create a new initial state based on your current simulation state. Be aware that your current initial configuration will be overwritten (and thus lost). |
|
Reset the simulation to its initial state and run from that point onwards. |


|
You have to restart your simulation after setting new init values in order for these changes to take effect. |
 Load and save sessions
A session (or snapshot) is a saved copy of the state (or configuration) of your simulation at a specific point in time. You can use it to restore your simulation to that particular state at a later moment.
Button |
Functionality |
|
Save the current state/configuration of the simulation into a session file. Sessions will be saved in the |
|
Restore the simulation to a specific state/configuration using a previously saved session file. on file. |


|
Avoid using spaces, commas and dots when naming session files. It will cause the simulation to crash when you restore that session file. Example: |
 Record and replay
You can record a sequence of operator actions using the recording function. Recording operator actions allows you to perform identical actions at a later time.
Button |
Active state |
Functionality |
|
|
Start recording. The button turns red when recording is active. |
|
|
Stop recording. The button turns green when the recording has stopped. |
|
|
Replay recording |


While recording, navigate to the SIM_RECORDING tab on the right side of the Simulator Control Box. Here you will find a list of all actions that will be stored in your recording file (Figure 3).

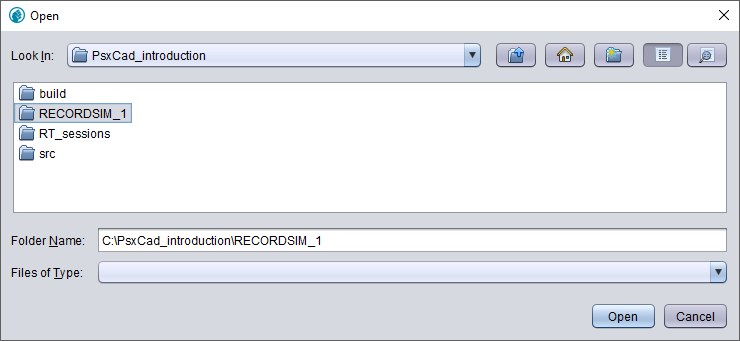
The files containing your recording will be saved in the same directory as where your project file is stored. Each recording will have its own folder named RECORDSIM_1, RECORDSIM_2, etc. (Figure 4)
 Conditional Breakpoints
Sometimes you may want to pause your simulation only when certain conditions are true. To achieve this you can use Conditional Breakpoints. If the condition is true, then your simulation breaks (or pauses) at the breakpoint. If the condition is false, then the simulation continues.
Tick box |
Active state |
Functionality |
|
|
Pause simulation when certain criteria are met. |


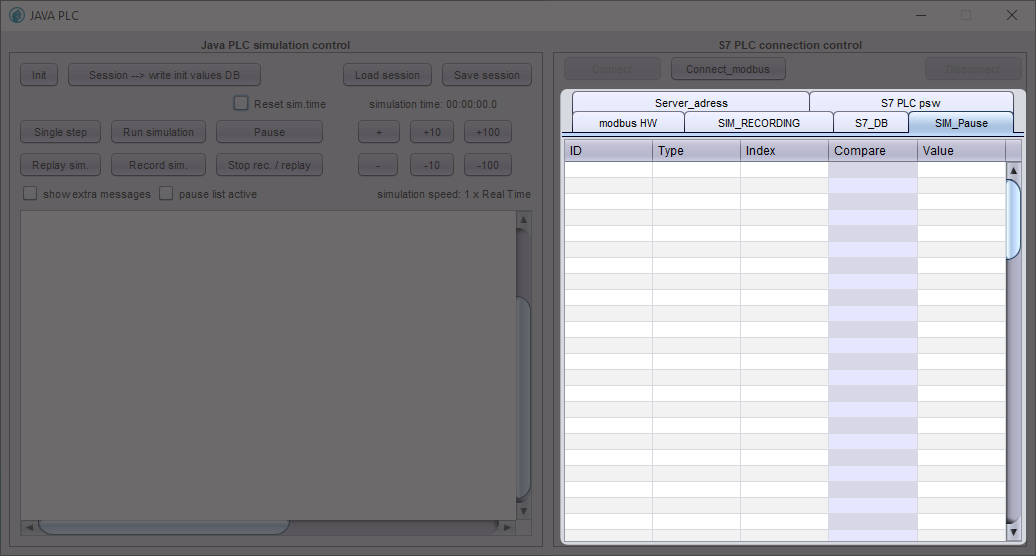
To enable Conditional Breakpoints, tick the box in front of Pause list active. All conditional breakpoints will appear in the list under the SIM_Pause_ tab on the right side of the Simulator Control Box (Figure 5).
There are two ways to add ID tags to this list:
-
Hover your mouse over a symbol with the ID tag you want to create a conditional breakpoint for and press F10.
-
Manually add ID tags to the list
You can set new or edit existing conditions by changing the compare function and value.
 Logging and Debug Console
The Logging and Debug Console enables you to view output and error messages. When errors occur during simulation, checking these error logs is the first step for determining the nature of the problem.
Tick box |
Active state |
Functionality |
|
|
When enabled, the Logging and Debug Console will show additional messages (e.g., commands, cycle time). |