Graphic symbols
On this page you can find explanations for usage and descriptions of each graphic symbol in the basic library for PsxCad. This library is included within the download of PsxCad and is meant as a clean sheet for starting a brand new project. Because of this the graphical symbols in this project are meant as examples.
Graphic symbols have only visual properties and will not contain any preprogrammed logical functions. In order to use some of them correctly some effort in building logics for them is needed.
Graphic symbols
AI_INDICATOR

The AI_INDICATOR visualizes a value on the screen. Writing "#PSX#INLINE_VALUE" in its popup name field makes the value adjustable for the operator.
Graphical parameters
Tag |
initial value |
Description |
CV_value |
0.0 |
The value displayed on the symbol |
DESIGN |
false |
Inverts the text color |
EDIT_COLOR |
r=153,g=255,b=153 |
Color of the background while INLINE_VALUE is true |
INLINE_VALUE |
false |
Enabled EDIT_COLOR as the background color |
font |
Verdana |
Font used for displaying the value |
font_type |
0 |
Font type for displaying the value 0: normal 1: bold 2: italic |
formatter |
0.0 |
Format for displaying the value |
popupOpened |
false |
Highlights the symbol with a green circumference |
ALARM_ACTIVE

The ALARM_ACTIVE visualizes a message for the operator. By default a message for an active alarm.
Graphical parameters
Tag |
initial value |
Description |
CV_VALUE |
true |
Enables visibility of the symbol |
TEXT |
ALARM ACTIVE |
Text on the symbol |
T_TRENDLINE
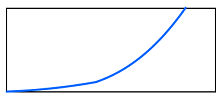
The T_TRENDLINE symbol visualizes a trendline. This is done by using a object value, in other words an array, to draw a polygon symbol. PsxCad draws a polygon with a inverted Y-axis.
Graphical parameters
Tag |
initial value |
Description |
CV_VALUE |
[0]=0.0;[1]=0.0; |
Object used for drawing the line in the trendline |
DRAWING_TYPE |
0 |
Selector for types of curving on the line 0=LineTo 1=curveTo 2=quadTo |
LIJNDIKTE |
2.0 |
width of the line |
LIJNKLEUR |
r=255,g=255,b=0 |
Second color of the line, used for gradiant |
LIJNKLEUR2 |
r=0,g=102,b=255 |
Main color of the line |
RECT_VISIBLE |
true |
Enables visibility of the perimeter |
GRAPH_POINT
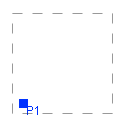
The GRAPH_POINT symbol visualizes a point in a graph. This for example can be combined with a trendline to visualize the current value.
Graphical parameters
Tag |
initial value |
Description |
COLOR |
r=0,g=51,b=255 |
Coloring for the point and text in the graph |
CV_X |
10 |
X value on the X-axis determining the position of the displayed point |
CV_Y |
10 |
Y value on the Y-axis determining the position of the displayed point |
HIGH_SCALE |
100.0 |
Higher boundary for scaling the X-axis |
HIGH_SCALE_Y |
100.0 |
Higher boundary for scaling the Y-axis |
LOW_SCALE |
0.0 |
Lower boundary for scaling the X-axis |
LOW_SCALE_Y |
0.0 |
Lower boundary for scaling the Y-axis |
RECTANGLE_VISIBLE |
true |
Makes the perimeter of the symbol visible |
TEKST |
P1 |
Text displayed at the point in the graph |
BUTTON_HMI
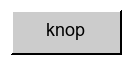
The BUTTON_HMI symbol visualizes a pressable button. It is configured to toggle a boolean signal for one cycle with the runtime function 218 when clicked.
Graphical parameters
Tag |
initial value |
Description |
CV_ENABLED |
true |
Visualization of a enabled or disabled button |
CV_NR |
0 |
Adjustable themes or coloring of the button |
CV_PRESSED |
false |
Changes button layout to indicate it being pressed or unpressed |
FONT |
SansSerif |
Font of the text |
GROOTTE |
18 |
Text size |
STIJL |
0 |
Unused variable |
TXT0 |
knop |
Text displayed on the button |